 At the end of May, the current transportation law MAP-21 will expire unless Congress acts. Leaders in the House and Senate are currently wrestling over their options, with Congress likely to extend the current law until at least July and possibly through the rest of the year.
Resource Library
This document describes strategies used to implement collaborative and comprehensive education reform at all levels.
 There is no doubt that good walking and biking infrastructure is essential to successful Safe Routes to School programs. However, many communities already have “the bones” of adequate infrastructure, especially around established community-based schools in suburban and urban communities, or through completed Safe Routes to School-funded engineering projects.
This resource documents findings from a survey of school principals in Kentucky about shared use of school facilities with community agencies during non-school hours. The survey was intended to gather baseline data about shared use in Kentucky as well as challenges, opportunities, and best practices for establishing shared use.
It is with great pleasure that I share some exciting news with you. On August 3, 2015, the Safe Routes Partnership voted to expand its Board of Directors and voted in two new persons to serve as board members. Led by Board Chair Risa Wilkerson, the Board of Directors has been actively researching and working through targeted board development for the last year. These two new members bring a wealth of experience, the willingness to roll up their sleeves and get to work as well as a commitment to the sustainability of our organization. We truly could not be more pleased.
School districts are responsible for the education of almost 50 million public school students. This report identifies the larger community interest in decisions about retaining existing schools and deciding where to locate new ones.
Last week, the Surgeon General issued a powerful call to action urging all Americans to champion walking and walkable communities. By now hopefully you have heard this and are already putting efforts in place to align your school, nonprofit organization, or business with this game-changing ask. I was gratified to be present in Washington, DC when Dr. Murthy made the announcement, and at the Safe Routes Partnership we are moving forward without hesitation.
This study used a computer-based model of adults’ walking behavior in a hypotheticalcity to examine the possible impact of interventions on overall walking, andon walking for different purposes, among different socioeconomic groups.
This guest blog post was written by our research advisor, Christina Galardi.
In advocating for Safe Routes to School programs in your area, you might face two major questions from school administrators, local planners, or political leaders:
- Will Safe Routes to School really increase students’ rates of walking and biking to school?
- Is Safe Routes to School worth the investment?
Two rigorous research studies published in the past year provide evidence for the health and economic benefits of Safe Routes to School to support your response.
All public school districts nationwide are required to implement a “wellness policy” to promote student health. This fact sheet is designed to help parents and community advocates ensure that their district’s policy is enforced.
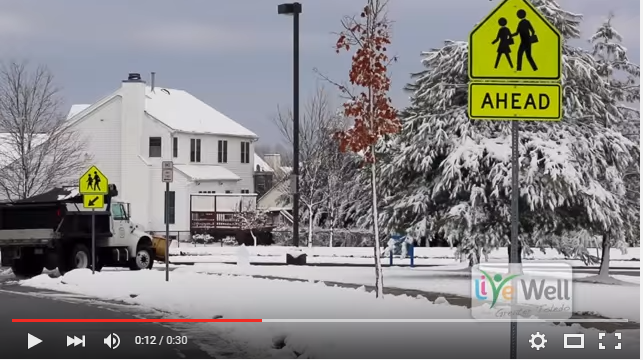
Snow has been in the news lately, and communities, Safe Routes to School Programs, and walking advocates are stepping up and sharing solutions and tips for students and residents to walk safely in the snow. Personal preparation and community education and engagement are the best solutions to walking during the winter months.
Public Health online assist individuals interested in the Public Health field on different professions offered. In addition, the resource provides the public with expert driven information and resources on public health topics
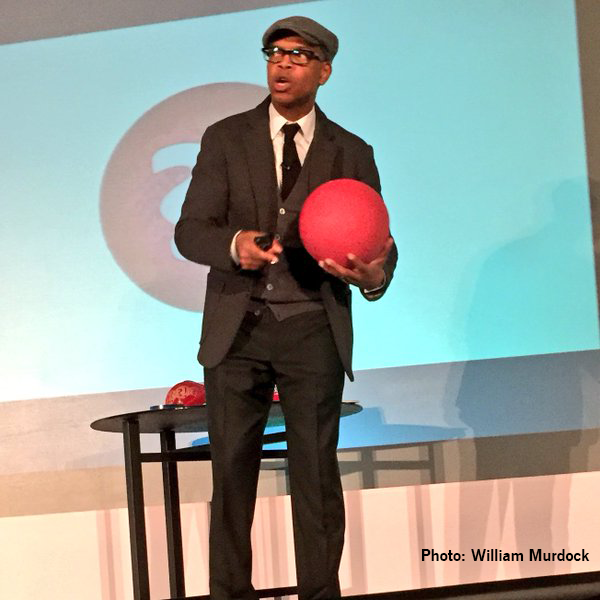 The National Conference is off to a strong start here in Columbus, Ohio.
Look both ways. Wear your helmet. We’ve all heard these maxims about safety, and probably shared them a time or two.
Aside from distance to school, safety is a leading factor for both adults and children in the decision to participate in physical activity and walk or bike to school (Nasar, 2015; Zhou et al., 2009). However, adopting those individual protective behaviors will not provide an easy solution. This blog post will unpack three reasons why the concept of safety, particularly in the context of safe travel to school, can be challenging to conceptualize and achieve.
This mid-course report examines the research literature and provides recommendations for increasing physical activity levels of American youth across five key settings: Schools, Preschool and Childcare, Community, Home, and Healthcare.
Inspiring. Enthusiastic. Partnerships. Youth Leadership. Social Justice. Creating a Positive Future. Those are a few words I’d use to describe the mood, energy and intention of the 3rd Safe Routes to School National Conference in Minneapolis.
As the more than 600 participants entered the Minneapolis Convention Center on August 17, the second day of the conference, the room was buzzing with people talking about workshops and connections they made the day before.
 Partnerships…
…a good thing to be writing about on Valentine’s Day. I guess you could say I am the Safe Routes Partnership’s resident matchmaker. While I can boast of several marriage outcomes from my partnership recommendations over the years, my role here at the Safe Routes Partnership has yet to involve dating suggestions.
 True or False: Physically active children perform better academically than their less active counterparts. TRUE! But you don’t have to take my word for it.
 As someone who has been involved with Safe Routes to School for over nine years, it has been very satisfying – let alone exciting – to see the Safe Routes Partnership’s state network project not only thrive, but continue to get generously funded. And being personally involved has only made it that much sweeter. Prior to joining the staff in May 2011, I served on the Safe Routes Partnersh
