Studies show Safe Routes to School initiatives have health and safety benefits for students, as well as benefits extending to the whole community.
Increased walking and bicycling to school
Studies have shown an increase in walking and biking to school through Safe Routes to School projects and programs.
- A study of 801 schools in Washington DC, Florida, Texas, and Oregon showed an average 25 percent increase in walking and bicycling to school over a five-year period associated with education and encouragement programs, and an average 18 percent increase associated with infrastructure improvements. This means that a school that combines infrastructure improvements with education and encouragement programs is likely to see increases in walking or biking of up to 43 percent.1
- A study of 53 schools in four states (Fl, MS, WA, and WI) found that schools with Safe Routes to School funded projects increased walking and bicycling to school by 37 percent.2
Safer students
Safe Routes to School addresses traffic dangers and improves safety for students.
- A New York City study found a 44 percent decline in pedestrian injury among school children in areas with Safe Routes to School projects, compared to no change in locations without. The costs savings associated with injury reduction would achieve an overall net societal benefit of $230 million over a projected 50-year period.3
- A study of 47 schools in California found that Safe Routes to School infrastructure improvements resulted in a 75 percent reduction in collisions involving people of all ages walking and bicycling.4
Lower transportation costs for school districts and families
Safe Routes to school provides low-cost options for students to get to and from school, reducing the amount of money needed for personal vehicle use and busing.
- Transportation is the second highest household expense in the United States. Driving a newer sedan costs an average annual amount of $8,946 ($0.60 per mile).5
- Approximately 55 percent of children in the US are bused to school, and $21.5 billion is spent nationall each year on school bus transportation, an average of $854 per child transported per year.6 School districts currently spend $100 million to $500 million annually to bus children for just one or two miles due to hazardous conditions. Improving walking conditions near schools could reduce this cost substantially, by decreasing the need for school bus service for students who live close enough to walk or bike to and from school.7
Reduced student absences and tardiness
Lack of transportation can be a barrier to getting to school on time or at all, especially for students in disadvantaged communities.
- A Walking School Bus study in Springfield, Massachusetts showed that students participating in the program had a somewhat better attendance rate (approximately 2 percent) than their peers. The study reported that one student who was tardy or absent 22 days in the 2010-11 school year was not late or absent once after joining the program.8
Reduced traffic congestion
Neighborhoods are becoming increasingly clogged by traffic. By boosting the number of students walking and bicycling, Safe Routes to School projects and programs reduce traffic congestion.

- In 2009, school travel by private vehicle accounted for 10 to 14 percent of all automobile trips made during morning rush hour.9
- While distance to school is the most commonly reported barrier to walking and bicycling,10 private vehicles still account for half of school trips between 1/4 and 1/2 mile11—a distance easily covered on foot or bike.
Healthier students
Safe Routes to School supports increased physical activity, helps form healthy habits that can last a lifetime, and decreases the risk of chronic disease and obesity.
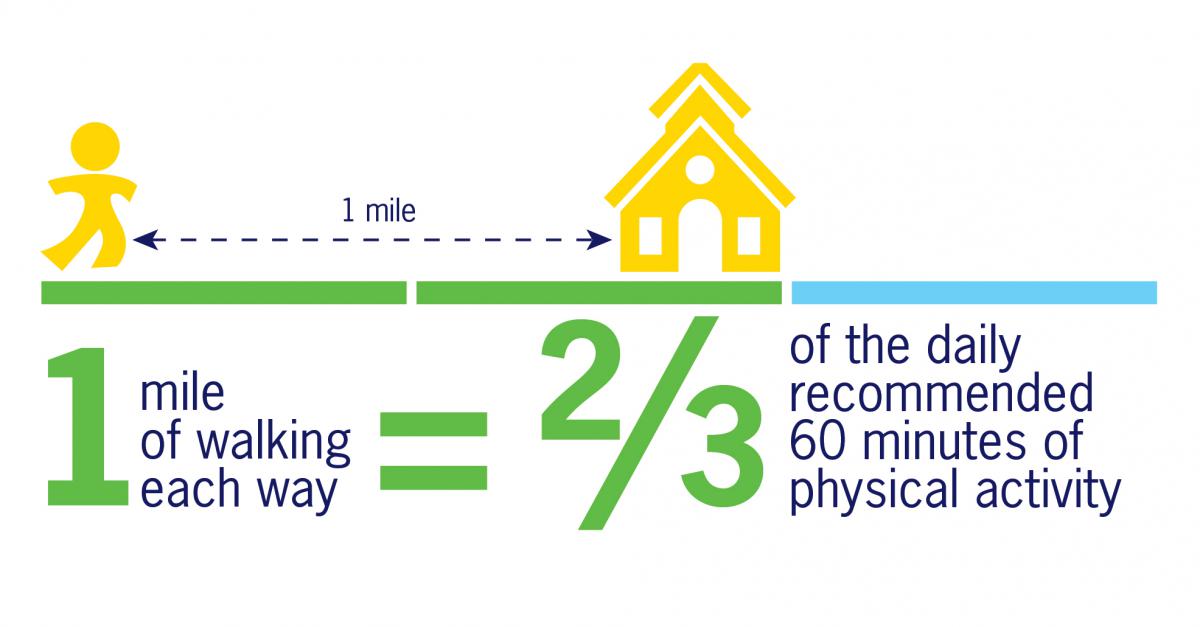
- Walking one mile to and from school each day is two-thirds of the recommended sixty minutes of physical activity a day.
- Children who walk to school have higher levels of physical activity throughout the day.12,13
Improved academic performance
Student health has been linked to academic performance. Walking and biking to school can help ensure students arrive ready to learn.
- One study found that after walking for 20 minutes, children responded to test questions with greater accuracy and had more brain activity than children who had been sitting. Children also completed learning tasks faster and more accurately following physical activity.14
- Physically fit children have larger hippocampal volume and basal ganglia, brain components both connected with learning.15
Clean air and fewer asthma attacks
Safe Routes to School programs can improve air quality by reducing vehicle trips and miles traveled.
- Over the last 25 years, among children ages 5 to 14, there has been a 74 percent increase in asthma cases.16 In addition, 14 million days of school are missed every year due to asthma.17
- One-third of schools are in "air pollution danger zones."18
- Children exposed to traffic pollution are more likely to have asthma, permanent lung deficits, and a higher risk of heart and lung problems as adults.19
References
- Noreen McDonald, Ruth Steiner, Chanam Lee, Tori Rhoulac Smith, Xuemei Zhu and Yizhao Yang (2014). “Impact of the Safe Routes to School Program on Walking and Bicycling.” Journal of the American Planning Association. Vol 80, Iss 2, p 153-167.
- Orion Stewart, Anne Vernez Moudon, and Charlotte Claybrooke (2014) Multistate Evaluation of Safe Routes to School Programs. American Journal of Health Promotion: January/February 2014, Vol. 28, No. sp3, pp. S89-S96.
- Peter A Muennig et al., 'The Cost-Effectiveness Of New York City’s Safe Routes To School Program', American Journal Of Public Health, iss 0 (2014): 1-6.
- David Ragland, S Pande, J Bigham and FJ Cooper. (2014, January). Ten years later: examining the long-term impact of the California Safe Routes to School program. Presented at the Transportation Research Board 93rd Annual Meeting, Washington DC. Available at http://docs.trb.org/prp/14-4226.pdf.
- AAA. Cost of Owning and Operating Vehicle in U.S. Increased 1.9% According to AAA’s 2012 Your Driving Costs Study. 2012. http://newsroom.aaa.com/2012/04/costof-owning-and-operating-vehicle-in-….
- Digest of Education Statistics, 2010. Tables 184, 186 and 187. Washington, DC: U.S. Department of Education, National Center for Education Statistics, 2011.
- McDonald NC, Steiner RL, Palmer WM, Bullock, AN, Sisiopiku, VP, Lytle BF. Costs of school transportation: quantifying the fiscal impacts of encouraging walking and bicycling for school travel. Transportation. 2014; doi:10.1007/s11116-014-9569-7.
- Attendance Works. “Springfield: Walking School Bus - Attendance Works.” Accessed August 22, 2016. http://www.attendanceworks.org/what-works/springfieldwalking-school-bus/.
- McDonald N., Brown A., Marchetti L., Pedroso M. (2011). U.S. School Travel 2009: An Assessment of Trends. American Journal of Preventive Medicine, 41(2), 146-151.
- U.S. Centers for Disease Control and Prevention, Morbidity and Mortality Weekly Report September 30, 2005, “Barriers to Children Walking to or from School, United States 2004.” Available at www.cdc.gov/mm wr/preview/mmwrhtml/mm5438a2.htm.
- Federal Highway Administration, National Household Travel Survey 2001; NHTS Brief on Travel to School, January 2008.
- Alexander et al., The broader impact of walking to school among adolescents. BMJonline.
- Cooper et al., Commuting to school: Are children who walk more physically active? Amer Journal of Preventative Medicine 2003: 25 (4)
- Hillman CH, Pontifex MB, Raine LB, Castelli DM, Hall EE, Kramer AF. The effect of acute treadmill walking on cognitive control and academic achievement in preadolescent children. Neuroscience. 2009;159(3):1044-1054. doi:10.1016/j.neuroscience.2009.01.057
- Castelli, D.M., Glowacki, E., Barcelona, J.M., Calvert, H.G., & Hwang, J. (2015). Active Education: Growing Evidence on Physical Activity and Academic Performance. [Research brief.] Active Living Research. http://activelivingresearch.org/sites/default/files/ALR_Brief_ActiveEdu….
- Centers for Disease Control and Prevention. Surveillance for Asthma—United States, 1960-1995: CDC Surveillance Summaries, April 24, 1998. MMWR Morbidity and Mortality Weekly Report, Vol. 47 (SS-1), 1998, pp. 1-27.
- Centers for Disease Control and Prevention. Healthy Youth! Health Topics: Asthma. Available at http://www.cdc.gov/HealthyYouth/asthma/index.htm.
- Appatova, A. S., Ryan, P., LeMasters, G., Grinshpun, S. “Proximal exposure of public schools and students to major roadways: a nationwide US survey,” Journal of Environmental Planning and Management, Volume 51, Issue 5, 2008.
- Gauderman, W. J., E. Avol, F. Lurmann, N. Kuenzli, F. Gilliland, J. Peters and R. McConnell, “Childhood Asthma and Exposure to Traffic and Nitrogen Dioxide,” Epidemiology, Volume 16, No. 6, November 2005. AND Gauderman, W.J., H. Vora, R. McConnell, K. Berhane, F. Gilliland, D. Thomas, F. Lurmann, E. Avol, N. Kunzli, M. Jerrett, and J. Peters, “Effect of exposure to traffic on lung development from 10 to 18 years of age: a cohort study,” The Lancet, Volume 368, February 2007.