Resource Library
 As we all head back to school, it is exciting to see more and more children and families walking and bicycling to school each morning.
 Ever wondered how effective Safe Routes to School programs are at increasing walking and bicycling to school? A new multi-state study gives a resounding answer to that question.

Residents of Centerville, SD, gathered in the warm prairie sunshine on a Saturday in September to celebrate completion of the first phase of a Safe Routes to School project. New sidewalks, curb and gutter, ADA curb ramps and traffic signs now make walking to school safer for school kids of all ages in this rural eastern South Dakota community of 882 people. New Safe Routes to School-funded programs to encourage walking to school are boosting the number of who do just that.
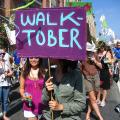
 Happy Walktober!

Many of the ideas presented are simple, but have immense potential to improve the overall success, health and well-being of our City’s students. This Active Design Toolkit for Schools provides ideas and resources to incorporate active design into your school.
 Over the last few months, a great deal of momentum and synergy has been built around schools and communities initiating joint use (or shared use) agreements, which allow for the sharing of property between two entities to increase physical activity and improve nutrition among their residents. Although these efforts are good and collabor
While the overwhelming majority of driving occurs within metropolitan areas, many large urban highways and arterial roads cost substantially more money to maintain than they generate in fuel taxes.
 August 13-15, 2013 will be here before we know it, so make your plans now to join us in Sacramento for the Safe Routes to School National Conference! Check out the revamped website at www.saferoutesconference.org, and take a look at our Save the Date.

This website provides a list of different audits for various settings and environmental attributes. The general purpose of an audit is to identify concerns for pedestrians and bicyclists related to the safety, access, comfort, and convenience of the environment.
 In 2005, North Carolina began a new era in how it viewed bicycles and pedestrians on its roadways. North Carolina Department of Transportation welcomed Safe Routes to School funding and created a specialty license plate that allowed its residents to show their support for bicycle and roadway safety.
As the project progresses, it will offer more precise benchmarks and recommendations for advocates and government officials so that they have the data they need to improve bicycling and walking in the United States and eventually all of North America.
 The Greater Washington DC region was recently ranked in a report as #1 for congestion.
 Of 52 documented Complete Streets policies in Florida, more than 20 were passed in 2012-2013. Florida network members were instrumental in the success of many of these policies.
These PowerPoint slides summarize MAP-21, its impact on transportation funding, and opportunities for supporting walking/biking projects.

School districts that adopt school bicycling or walking policies ensure that transportation safety rules for the district are consistent and standardized. Policies developed at this jurisdictional level can also help lay the groundwork for better and safer behaviors. This document provides a model school walking policy.

